Data Visualization
As a journalism student, I learned to think about everything narratively. I like to think it’s what’s made me a dot connector — looking for any and all through lines in order to truly understand a topic. I continue to bring this outlook with me as I combine my design skills with my journalistic skills, through information graphics, below.
01. Racial Disparity in Capital Punishment
After reading about the tragic killing of Brandon Bernard in December 2020, I spent the following weekend immersing myself in studies, research and editorial about the death penalty, with a focus on race. I thought about how I might visualize the complexities of what I learned in a digestible way to friends and family, on Instagram.
See this piece on Instagram here.
See this piece on Instagram here.
02. Police Funding in U.S. Cities
In Spring 2020, as the Black Lives Matter movement reached new, necessary heights, Instagram turned into a platform for activism, and I was inspired by the work other creatives were publishing to better educate and galvanize their communities.
When calls to defund the police emerged, I dove into city budget data to learn more. My partner and I looked at spending budgets for police, education and mental health services, among many others, to create this series of infographics. In it, we contextualize police spending in different cities across the U.S. We posted on both of our Instagram accounts, and we were met with a strong response — over 10,000 shares and 8,000 likes.
See this piece on Instagram here.
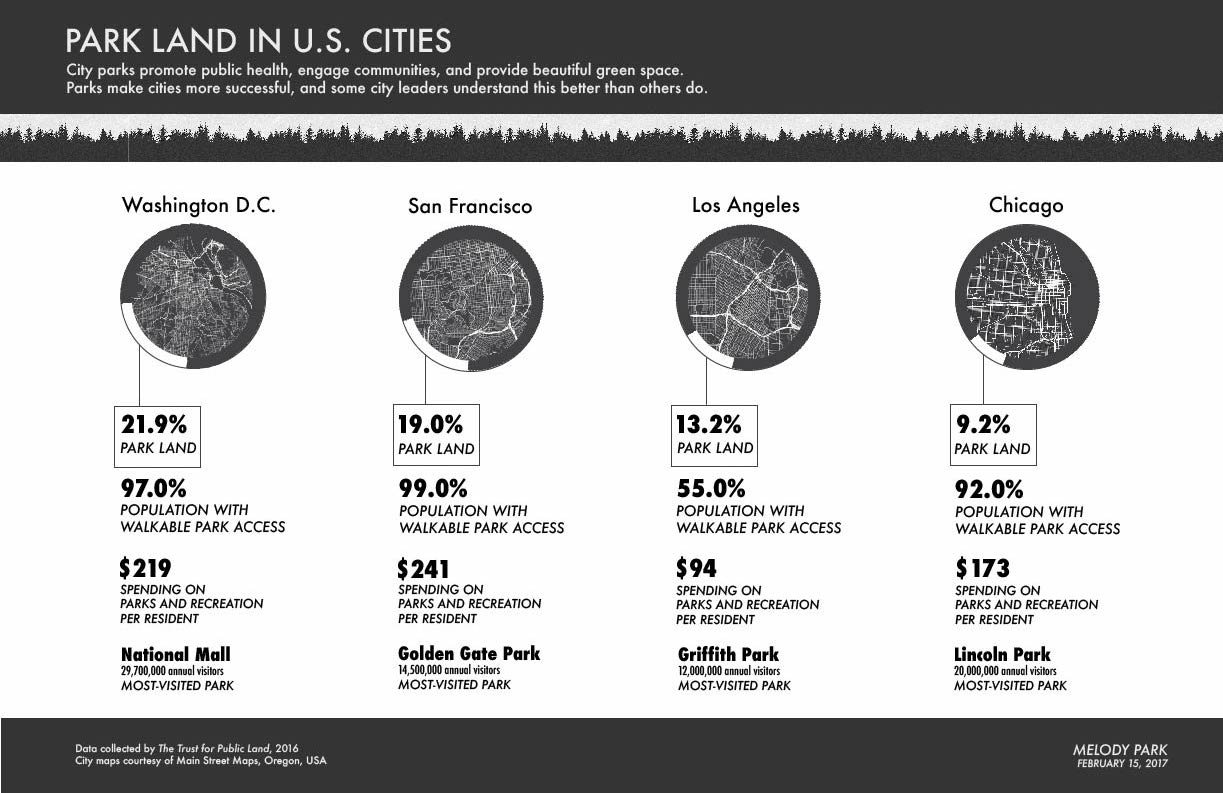
03. Park Land in U.S. Cities

For the majority of my college years, I was obsessed with urban design — how vastly city dwellers’ daily lives are impacted by seemingly tiny design decisions. For a class during winter quater 2017, I compared the land dedicated to parks and green space across the country to not only investigate the difference, but also to communciate the need to invest in more healthy public spaces for people to play, live, and learn in.